Overview
I designed and deployed a cloud-native Business Intelligence suite to provide real-time visibility into multi-channel eCommerce performance. By consolidating data from Takealot, Amazon, and MintSoft into a centralized Azure SQL backbone, I created a "Single Version of Truth" for inventory valuation, sales velocity, and cross-platform financial performance analysis.
Technical Deep Dive
Data Architecture & Cloud Integration
- The Technology: Engineered a robust ETL pipeline that fetches data from Azure SQL and CSV/Excel files hosted in Azure Blob Storage. This architecture ensures the model is "Cloud Native," allowing for scheduled refreshes independent of local hardware or user sessions.
- The Impact: Eliminated the "Siloed Data" problem. The dashboard provides a unified view of the business, where warehouse stock levels and marketplace sales are automatically synced and reconciled without manual intervention.
Advanced DAX & Semi-Additive Modeling
- The Technology: Implemented sophisticated DAX measures to handle semi-additive inventory snapshots. Unlike sales, inventory cannot be summed over time; it requires "Latest Snapshot" logic.
- Example: I authored
Latest Visible Inventory DateandInventory Value (Latest)measures that useCALCULATE,VALUES, andFILTERto ensure that when a user selects a month, the report displays the stock value as it existed on the final day of that period, not a sum of the whole month.
- Example: I authored
- The Impact: We can now accurately track the total capital tied up in stock across all fulfillment centers at any specific point in history.
Cross-Fact Intelligence (The "Has Data" Logic)
- The Technology: Developed complex "Context-Aware" measures (like
Has Data (All Facts)) to manage the relationship between Sales, Inventory, and Warehouse tables. By calculating dynamic Min/Max date ranges across three disparate fact tables, the model automatically adjusts its visual range to show only relevant data. - The Impact: Enhanced User Experience. The dashboard "self-cleans" by hiding empty time periods, ensuring that analysts only focus on periods where active trading or inventory movement occurred.
Business Insights & UI/UX
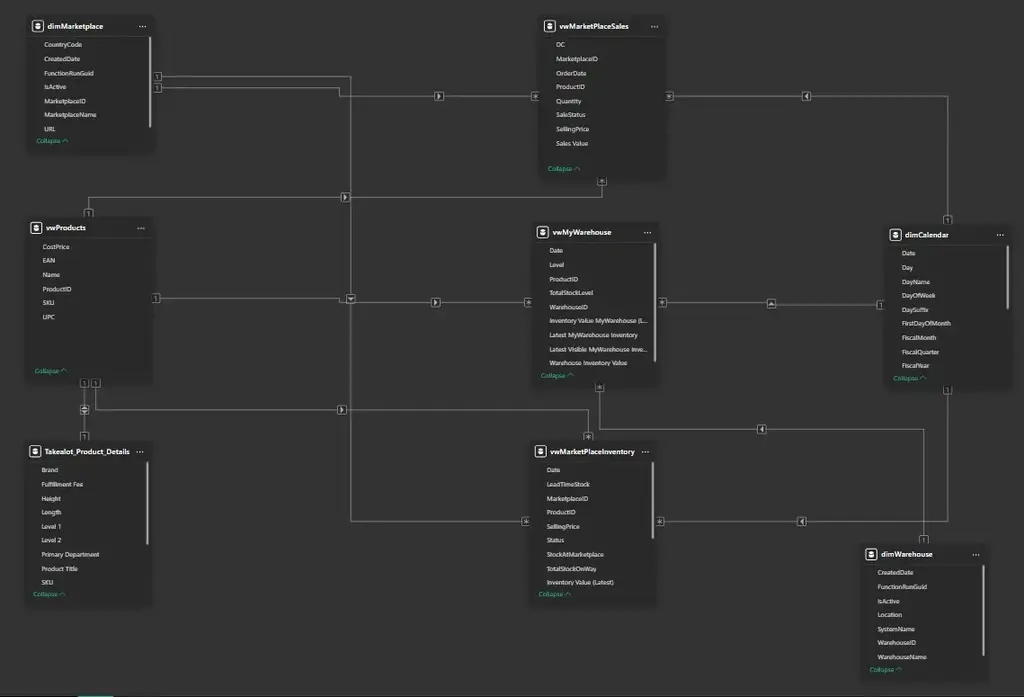
- Star Schema Optimization: The model is built on a high-performance Star Schema, separating Dimensions (Products, Calendar) from Facts (Sales, Inventory) to ensure sub-second report responsiveness.
- Financial Reconciliation: Automated the calculation of
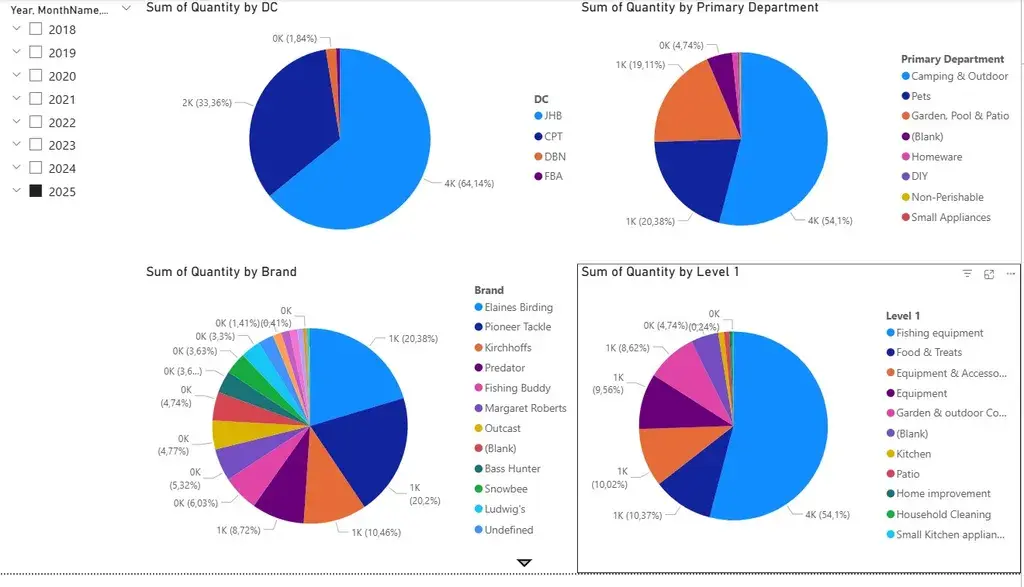
Marketplace Inventory Valueby usingRELATEDfunctions to pull cost-price data from the product master, providing an instant view of gross margin potential. - Data Storytelling: The report canvas utilizes interactive slicers and drill-throughs, allowing a user to see the "Big Picture" (Total Sales Value) before diving into specific SKU-level performance or DC-specific stock issues.
Cloud Native Data Access Design & Implementation
Power BI Service Deployment and scheduled refresh has been configured, connecting directly to Azure SQL database and using Azure Storage Account Blob Storage for additional lookup and data files. Access to these file are granted via a SAS token and the files are managed with the Microsoft Azure Storage Explorer application. (Alternative solution could have been to use OneDrive for Business or Sharepoint because Power BI integrates natively with these.) The enitre solution is cloud native with no dependency on any local, “always on” machines or logged in user accounts.
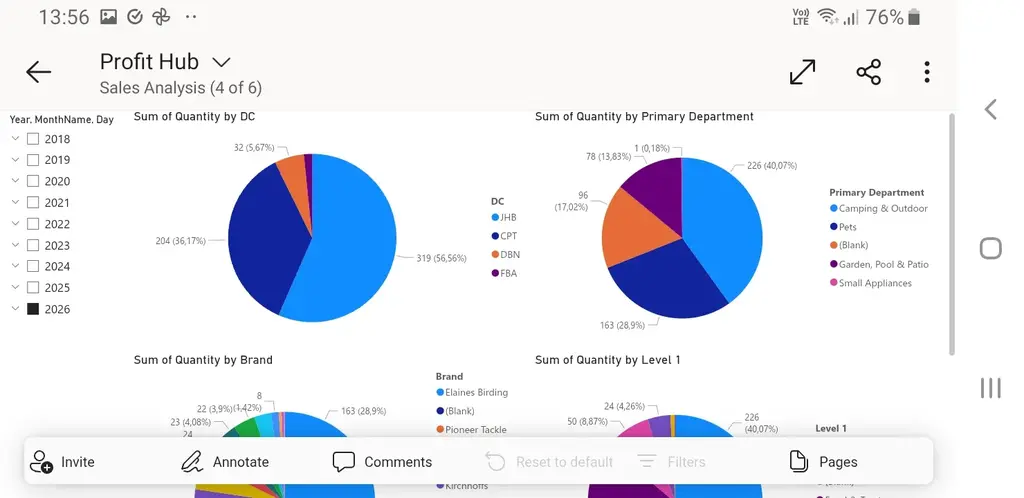
Mobile Access
Up to date access to reports and dashboards via Power BI Mobile App
Star Schema Data Model wiyh Custom Date / Calendar Table
Portfolio Perspective
This project demonstrates my ability to manage the full data lifecycle. From cloud-based storage and SQL modeling to advanced DAX analytics. By solving the technical challenge of semi-additive inventory valuation, I delivered a tool that provides the business with a 360-degree view of its multi-channel operations, enabling data-driven decisions on procurement and promotional strategy.